
Fájl:Anscombe.svg

Eredeti fájl (SVG fájl, névlegesen 945 × 630 képpont, fájlméret: 57 KB)
|
Ez a fájl a Wikimedia Commonsból származik. Az alább látható leírás az ottani dokumentációjának másolata. A Commons projekt szabad licencű kép- és multimédiatár. Segíts te is az építésében! |
Összefoglaló
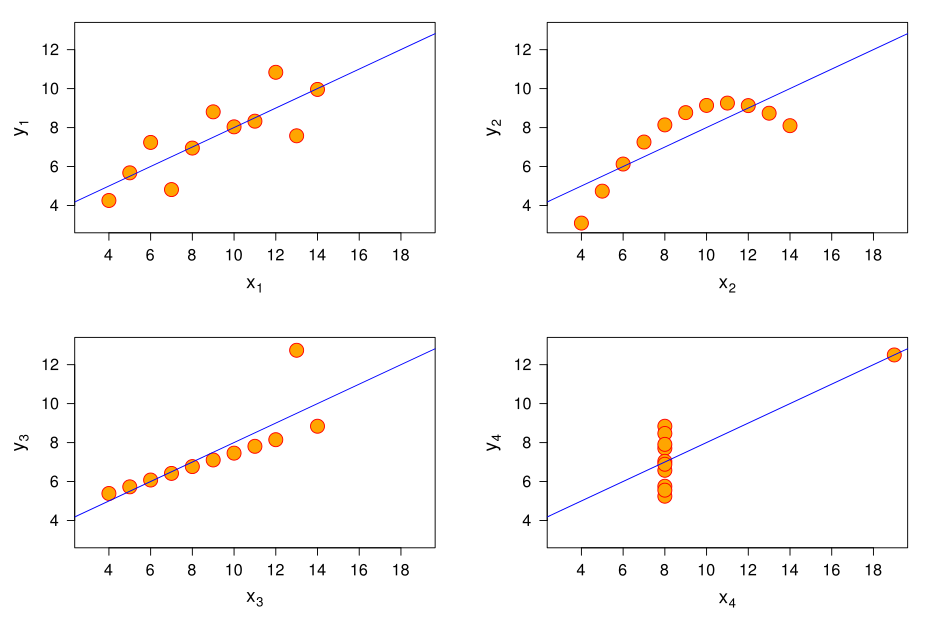
This graphic represents the four datasets defined by Francis Anscombe for which some of the usual statistical properties (mean, variance, correlation and regression line) are the same, even though the datasets are different.
| Property | Value |
|---|---|
| Mean of each variable | 9.0 |
| Variance of each variable | 11.0 |
| Mean of each variable | 7.5 |
| Variance of each variable | 4.12 |
| Correlation between each and variable | 0.816 |
| Regression line |


The graph was created by User:Schutz for Wikipedia on 13 June 2006 (and updated on 29 March 2010), using the R statistical project. The program that generated the graphic is given below; it is based on the example provided with the help page of the R dataset anscombe (accessible using the command data(anscombe); help and more information about the dataset is available using the command help(anscombe)), and was slightly modified to improve the result. The graph was directly exported in SVG format.
References:
- Anscombe, Francis J. (1973) Graphs in statistical analysis. American Statistician, 27, 17–21.
- R Development Core Team. R: A Language and Environment for Statistical Computing. R Foundation for Statistical Computing. Vienna, Austria. 2006. ISBN 3-900051-07-0. http://www.R-project.org
 svg("anscombe.svg", width=10.5, height=7)
 par(las=1)

 ##-- some "magic" to do the 4 regressions in a loop:
 ff <- y ~ x
 for(i in 1:4) {
   ff[2:3] <- lapply(paste(c("y","x"), i, sep=""), as.name)
   ## or   ff2 <- as.name(paste("y", i, sep=""))
   ##      ff3 <- as.name(paste("x", i, sep=""))
   assign(paste("lm.",i,sep=""), lmi <- lm(ff, data= anscombe))
 }

 ## Now, do what you should have done in the first place: PLOTS
 op <- par(mfrow=c(2,2), mar=1.5+c(4,3.5,0,1), oma=c(0,0,0,0),
           lab=c(6,6,7), cex.lab=1.5, cex.axis=1.3, mgp=c(3,1,0))
 for(i in 1:4) {
   ff[2:3] <- lapply(paste(c("y","x"), i, sep=""), as.name)
   plot(ff, data =anscombe, col="red", pch=21, bg = "orange", cex = 2.5,
        xlim=c(3,19), ylim=c(3,13),
        xlab=eval(substitute(expression(x[i]), list(i=i))),
        ylab=eval(substitute(expression(y[i]), list(i=i))))
   abline(get(paste("lm.",i,sep="")), col="blue")
 }

 dev.off()
Licenc
The R project is licensed under the GPL [1]; since this image is a derived work of an example script provided with R, it is also licenced under the GPL.
However, all modifications made by User:Schutz are also licensed under the CC-BY-SA licence.

|
Ez a program szabad szoftver; terjeszthető illetve módosítható a Free Software Foundation által kiadott GNU General Public License dokumentumában leírtak; akár a licenc 2-es, akár (tetszőleges) későbbi változata szerint. Ez a program abban a reményben kerül közreadásra, hogy hasznos lesz, de minden egyéb garancia nélkül, az eladhatóságra vagy valamely célra való alkalmazhatóságra való származtatott garanciát is beleértve. További részleteket a GNU General Public License 2-es és 3-as változata tartalmaz. |
Derivative works
Származékos művek:
Fájltörténet
Kattints egy időpontra, hogy a fájl akkori állapotát láthasd.
| Dátum/idő | Bélyegkép | Felbontás | Feltöltő | Megjegyzés | |
|---|---|---|---|---|---|
| aktuális | 2010. március 29., 16:10 | | 945 × 630 (57 KB) | Schutz | |
| 2007. január 15., 01:07 |  | 990 × 677 (88 KB) | Schutz | ||
| 2007. január 15., 01:05 |  | 990 × 677 (88 KB) | Schutz | ||
| 2006. június 13., 22:37 |  | 1 044 × 750 (94 KB) | Schutz | ||
| 2006. június 13., 19:27 |  | 1 125 × 875 (94 KB) | Schutz |
Fájlhasználat
Az alábbi lap használja ezt a fájlt:
Globális fájlhasználat
A következő wikik használják ezt a fájlt:
- Használata itt: ca.wikipedia.org
- Használata itt: da.wikipedia.org
- Használata itt: en.wikipedia.org
- Használata itt: es.wikipedia.org
- Használata itt: eu.wikipedia.org
- Használata itt: fi.wikipedia.org
- Használata itt: fr.wikipedia.org
- Használata itt: fr.wikiversity.org
- Használata itt: he.wikibooks.org
- Használata itt: nl.wikipedia.org
- Használata itt: nl.wiktionary.org
- Használata itt: nn.wikipedia.org
- Használata itt: no.wikipedia.org
- Használata itt: ru.wikipedia.org
- Használata itt: su.wikipedia.org
- Használata itt: tr.wikipedia.org
- Használata itt: uk.wikipedia.org
- Használata itt: www.wikidata.org